Hi, I’m Ryan!
I’m a PhD candidate in the InfoVis Lab at the University of British Columbia, where I study patient-centric data visualization.
The goal of my research is to provide visualization tools for patients to help them communicate their health data to providers.
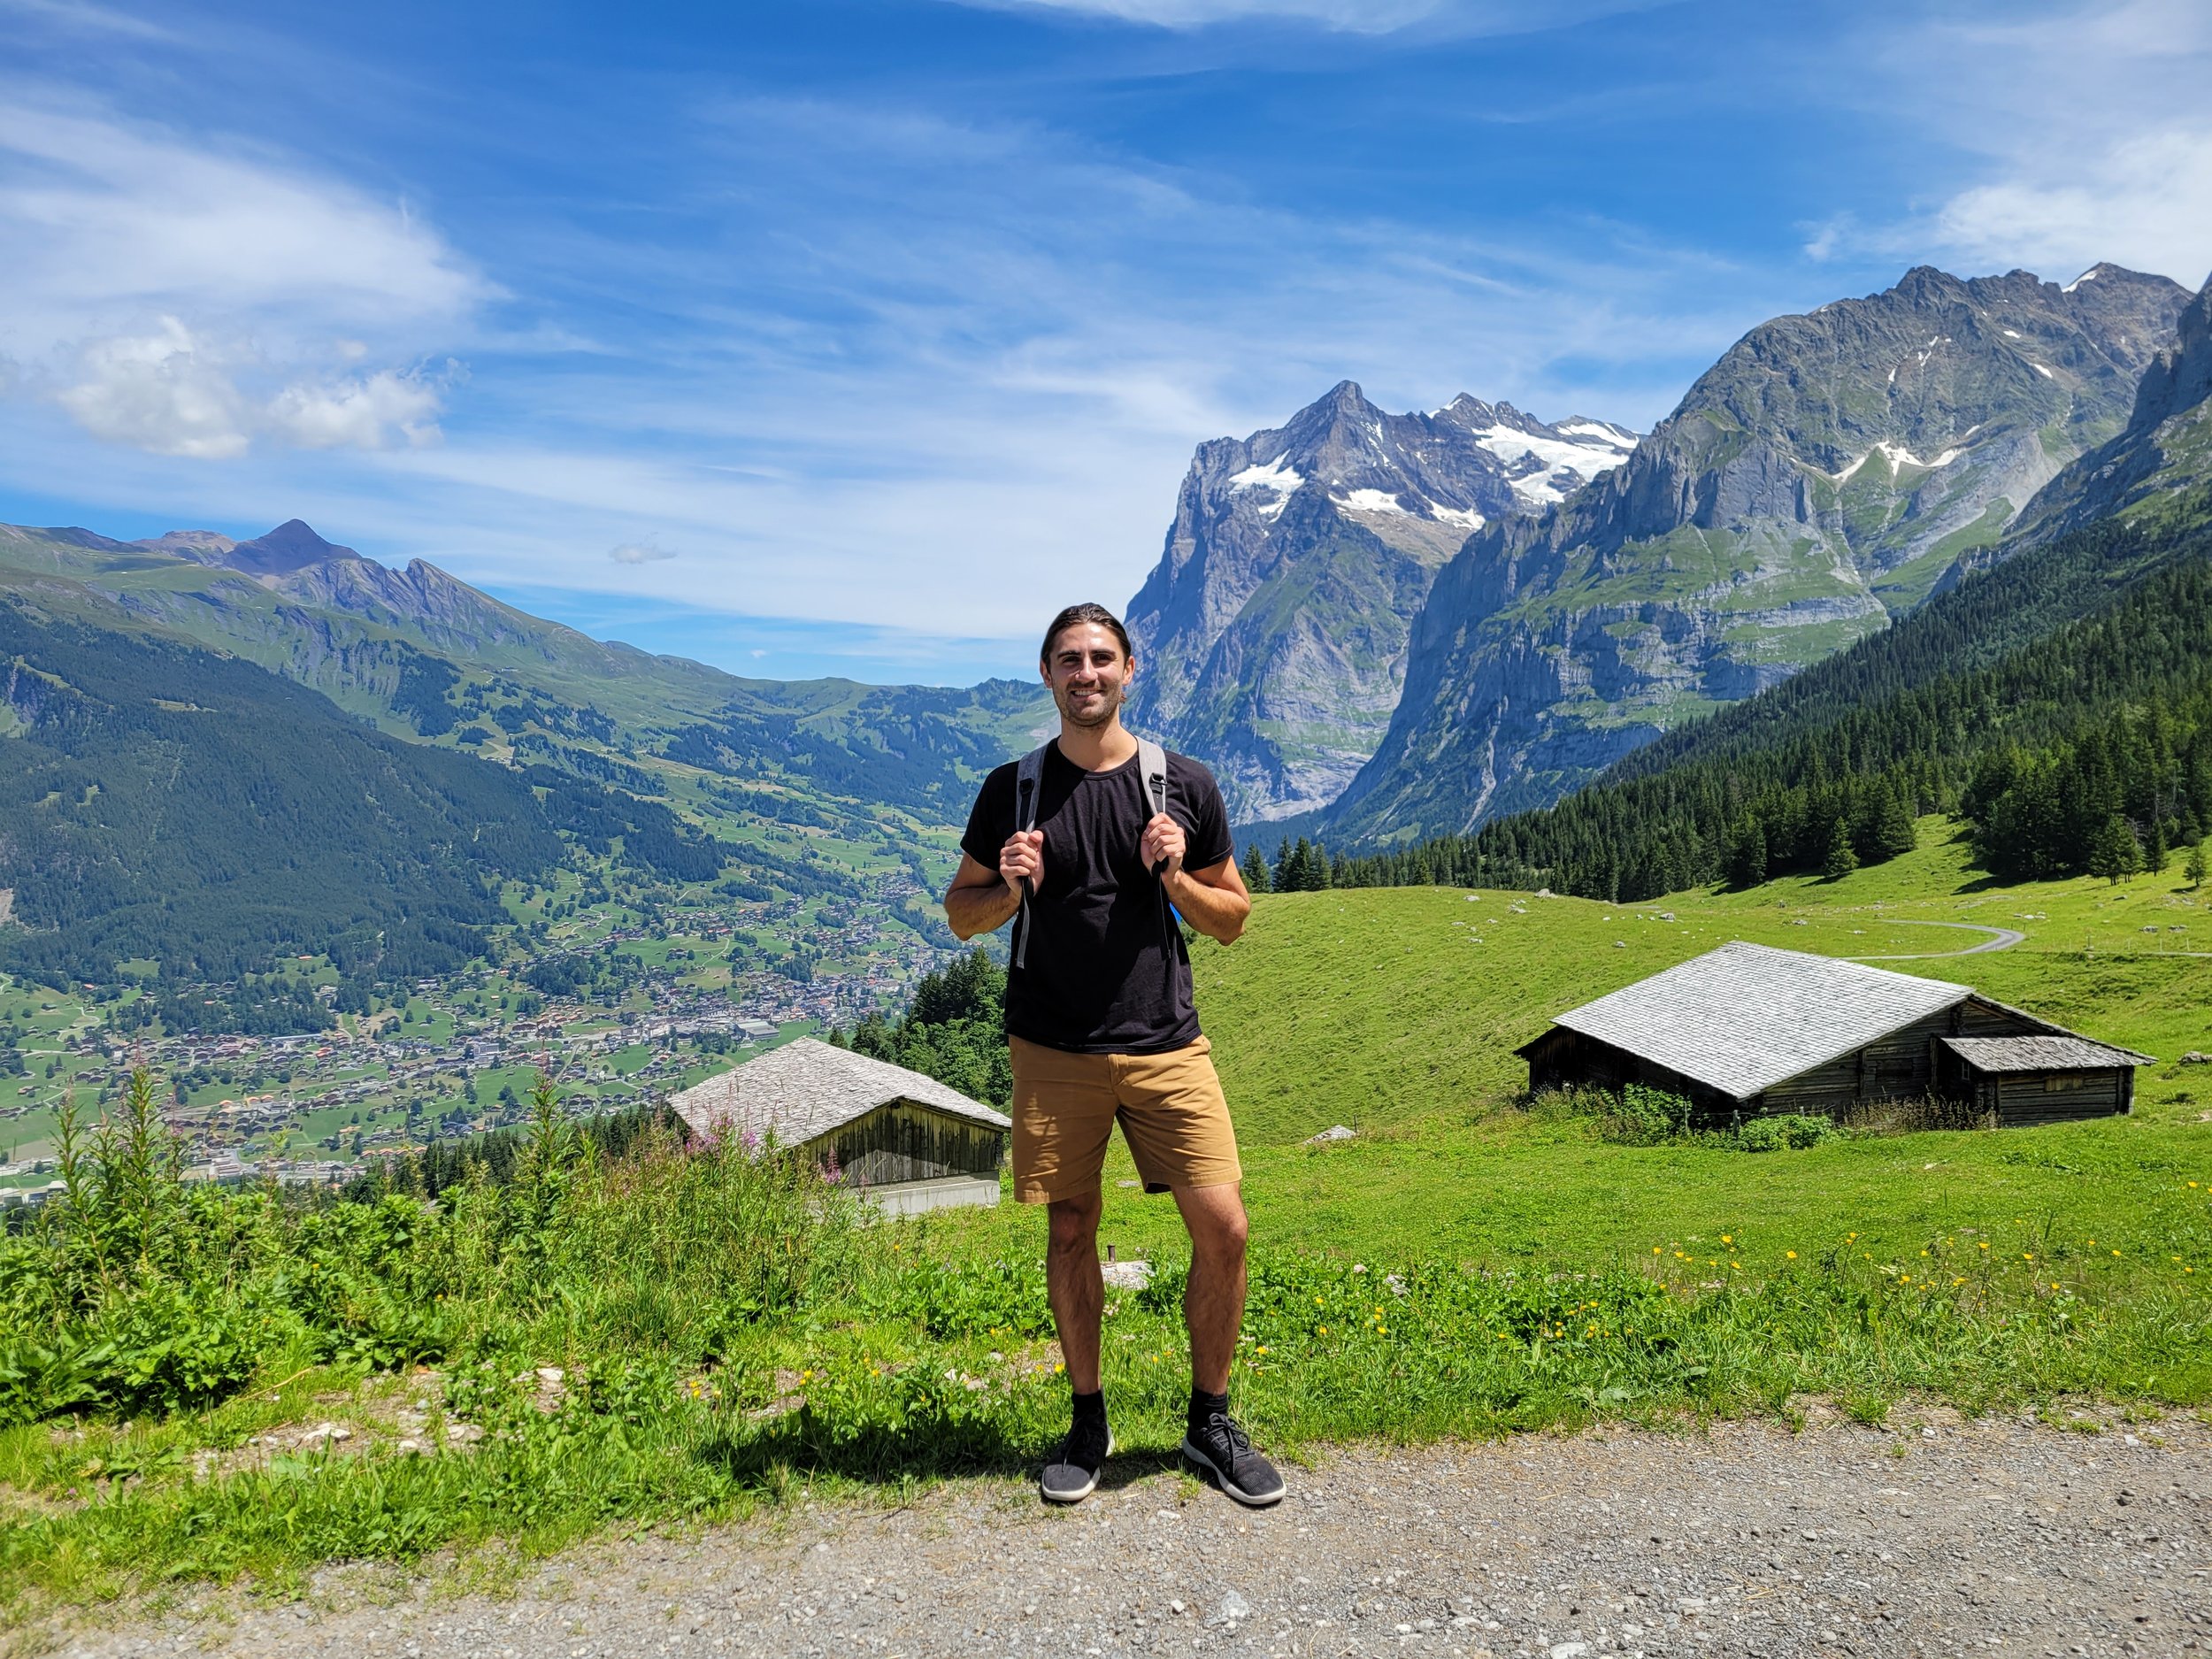
You can tell I’m a grad student in the Pacific Northwest by the obligatory hiking photo on my personal site.About me:

As you can see, I also own a suit. Which says something about my character. I’m not sure what. But it still says it!I hold a Bachelor’s degree in Psychology from Marist College and a Master’s degree in Social and Cognitive Psychology from New York University, where I focused on decision making.
After completing my studies, I worked as a research assistant in two psychology labs, the DUSC Lab and the Visual Thinking Lab, before applying to PhD Programs.
Although I was initially interested in neuroaesthetics (the neuroscience of art), I pivoted to data visualization after encountering an art installation that used visualization to explain a complex topic.
I began exploring whether people study this kind of work (they do!), and quickly fell in love with data visualization work and all the fascinating research associated with it.
I’ve since begun my PhD at the University of British Columbia, in the Computer Science Department, working with my supervisor, Tamara Munzner, in the InfoVis Lab.
Research Interests:
I’m interested in how people think about their data and how visualizations can help them build shared mental models of their subjective experiences.
I’m especially fascinated by how visualization leverages our existing psychological biases and cognitive processes to communicate complex ideas. The act of sitting down to reflect on your experiences, and then translating them into a form someone else can understand, can lead to both personal insight and meaningful shared communication!
To turn these ideas into action, I’m collaborating with Thrive Health, a digital health provider, and working on patient-centric visualization. Patients often struggle to communicate their health status to providers, and giving them tools to build a shared mental model can make a real difference.
My research looks to answer: How can patient-centric visualization support patients in effectively communicating with clinicians?

And have since replaced that phone.The scrubs aren’t mine.I no longer have long hair.So most of this photo is a lie.Current Projects:
Visualizing your health story
Health stories are more than a person’s medical history, they are a personal account of one’s health, combining medical facts with personal context and experiences.
A person’s health story can be complicated and difficult to communicate. Giving patients a tool that allows them to tell their story in a natural way can help them organize and track their medical history, communicate it more effectively to providers, and better understand it themselves.
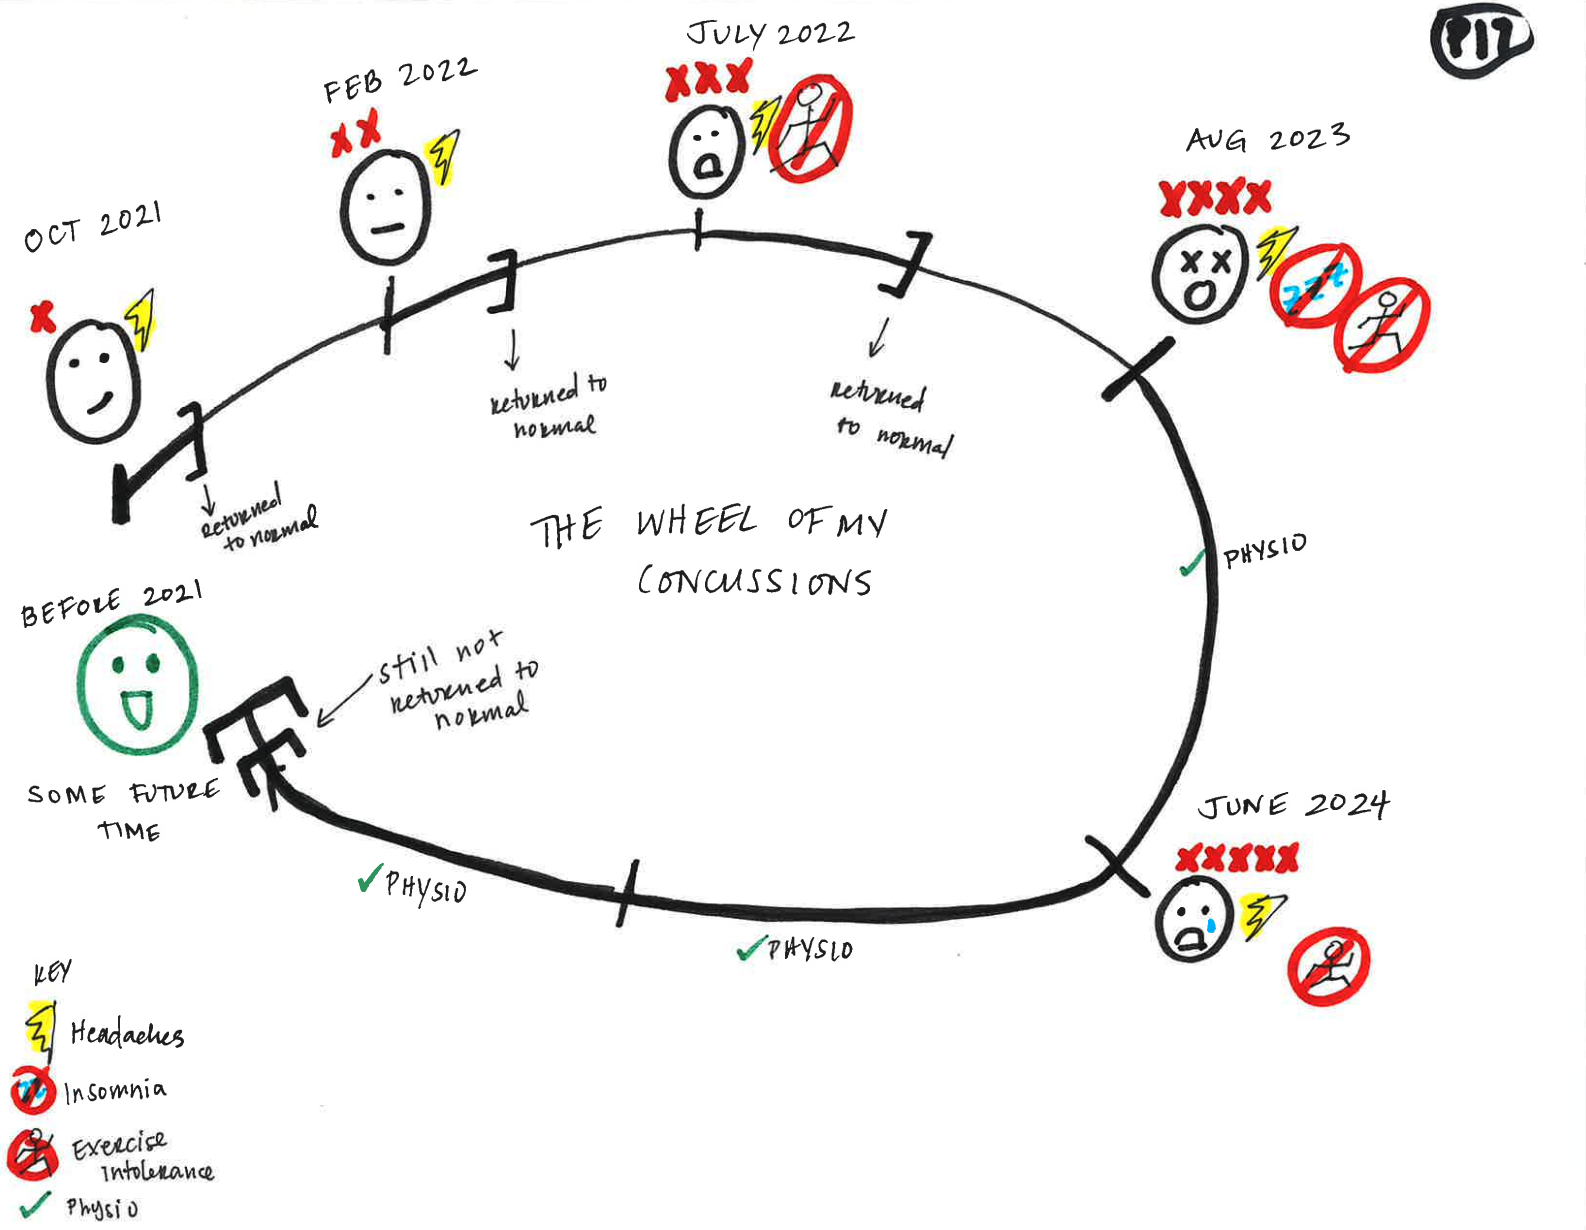
While our ultimate goal is to create a tool that enables patients to visualize their health story, we’ve just completed the initial phase: a health story sketching study. In this study, patients were asked to sketch out their health stories so we could better understand the design space and cognitive processes involved in this task.
You can see some of the examples of how creative people can be when thinking about how to best visualize their health story!


Visualizing medical form data
Medical data is tricky for a lot of reasons. It’s often inconsistent across providers, patients frequently feel misunderstood, and much of the information isn’t made up of easily quantifiable numbers; it’s a mix of free-form descriptions, timelines, and subjective experiences.
These challenges don’t just affect providers; they also create problems for patients trying to communicate their health status accurately. Visualizing this data can help patients better understand their own health and ensure that providers interpret the information in a way that aligns with how the patient thinks about it.
We’re currently prototyping this visualization tool, with the goal of helping both patients and providers organize and make sense of medical data, even when it’s complex, fragmented, and highly personal.


Published Work
First Author
2025
2021
R. Smith, A. Bellovary, and K. Quinn, “Sense of Place and Student Wellbeing: Preliminary Evidence for Impact of Liked but Not Disliked Spaces,” in Society for Personality and Social Psychology, Virtual, Feb. 2021.
R. Smith, W. Krenzer, K. Quinn, and P. Gomez, “The Cheerleader Effect: Replication and Extension,” in Psychonomic Society, Virtual, Nov. 2020.
2020
Other
I swear people want to work with me! The papers just haven't been published yet!Grants and Awards:
2025
MITACS Grant IT44143
A two year long $90k grant to collaborate with industry partner Thrive Health.
UBC Faculty of Science Excellence in Service Award
An annual award given to two students within UBC’s faculty of science for their service and positive impact in achieving the goals of the Faculty of Science.
2024
MITACS Grant IT38408
A year long $45k grant to collaborate with industry partner Thrive Health.
Yes, my mom was very proud of me!
She always is!!